
Data Science

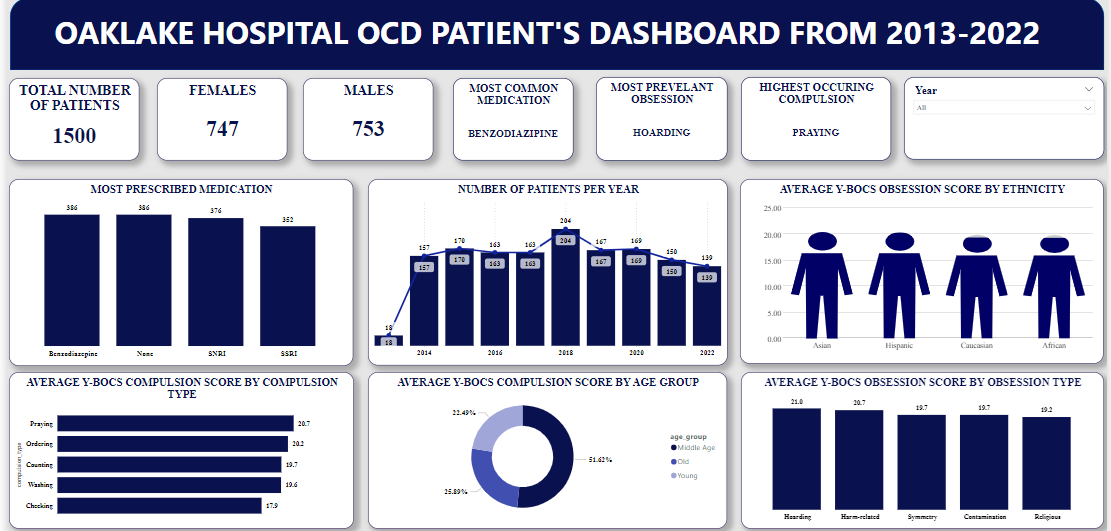
OCD PATIENT's DASHBOARD

  • Power BI
  • SQL
OCD PATIENT's DASHBOARD
overview

About this engagement

Data Analysis Project on OCD Patients (2013–2022)

Link: View Project File

Introduction

This project examines OCD patient data from 2013 to 2022 using SQL for data manipulation and Power BI for visualization. The goal is to uncover trends in prevalence, demographics, symptom severity, treatment modalities, and outcomes.

Data Source

Dataset obtained from Kaggle.

Objectives

  • Data Extraction with SQL (2013–2022)
  • Data Cleaning to remove duplicates and inconsistencies
  • Analysis of prevalence, severity trends, and treatment effectiveness
  • Visualization with Power BI dashboards and charts

Key Findings

  • Prevalence: Stable with slight increase in diagnoses
  • Demographics: Higher prevalence among females and younger individuals
  • Symptom Severity: Ranged from mild to severe impairment
  • Treatment: Combination of medication and therapy most common; CBT most effective
  • Outcomes: Most patients improved, though some had persistent symptoms

Want results like this for your business?

Tell us the decision you're trying to improve — we'll outline scope, timeline, and what it takes to ship.